Statistical Analysis
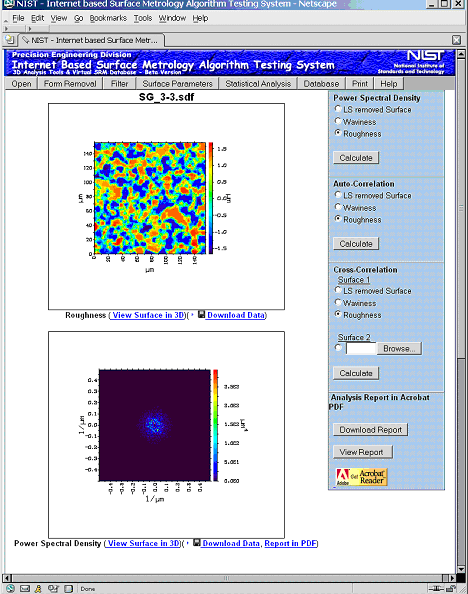
Power Spectral Density (PSD)
The 'PSD' menu displays the power spectral density interface which
allows the user to perform power spectral density analysis on a surface topography data set.
To perform the analysis,
1. On the right menu, select the type of a surface topography to be used, such as total surface,
waviness surface, or roughness surface
2. Click on the 'Calculate' button to perform the analysis.
The result shows two images. The first one shows the surface topography selected for
power spectral density analysis. The second one shows the calculated power spectral density
.
To download analysis data:
1. Click on the floppy disk icon and the Save dialog will display. It will ask where to save a zip file.
2. When the zip file is opened, data files in TXT and SDF
data format can be seen.
To view or download an analysis report in Acrobat PDF:
- Click on the 'View Report' Button to view the report
- Click on the 'Download Report' Button to download the report
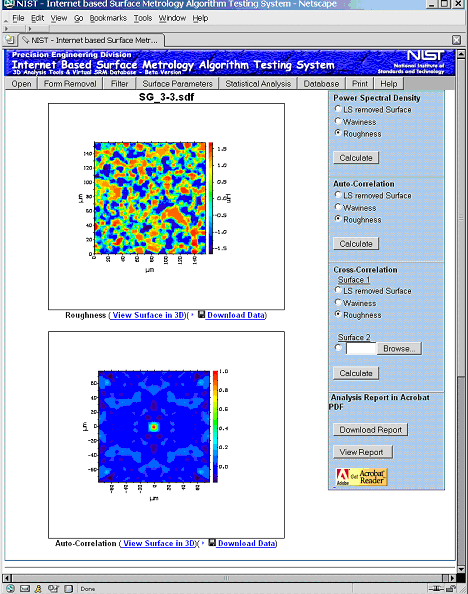
AutoCorrelation
The 'AutoCorrelation' menu displays the AutoCorrelation interface which
allows the user to perform Auto Correlation analysis on a surface topography data set.
To perform the analysis, the user
1. On the right menu, select the type of surface topography to be used, such as total surface,
waviness surface, or roughness surface
2. Click on the 'Calculate' button to perform the analysis.
The result shows two images. The first one shows the surface topography selected for
autocorrelation analysis. The second one shows the Auto Correlation Function.
To download analysis data:
1. Click on the floppy disk icon and the Save dialog will display. It will ask where to save a zip file.
2. When the zip file is opened, data files in TXT and SDF
data format can be seen.
To view or download an analysis report in Acrobat PDF:
- Click on the 'View Report' Button to view the report
- Click on the 'Download Report' Button to download the report
To view a surface in 3D view, click on "View Surface in 3D" besides the download icon.
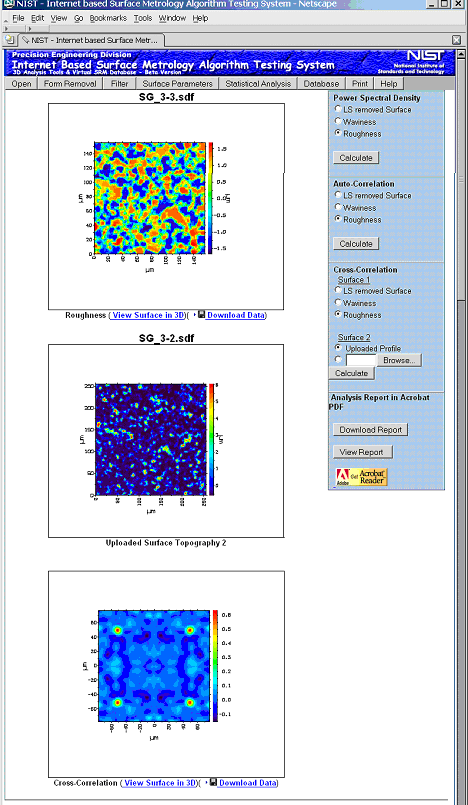
Cross Correlation
The 'Cross Correlation' menu displays Cross Correlation interface which
allows the user to perform Cross Correlation analysis on a surface topography data set.
To perform the analysis, the user
1. On the right menu, select the type of surface topography to be used, such as total surface,
waviness surface, or roughness surface
2. To upload a second surface topography to the system for cross correlation analysis,
the user needs to click on the 'Browse' button, which displays a File Open dialog. The user then
needs to change the sdf data file
format from the "Files of type' combo box for file selection. (The uploaded file check box is displayed after the second surface topography is uploaded
to the system.)
3. Click on the 'Calculate' button to perform the analysis.
The result shows three images. The first and second image show the surface topography selected for
cross correlation analysis. The third one shows the Cross Correlation Function.
To download analysis data:
1. Click on the floppy disk icon and the Save dialog will display. It will ask the user where a zip file will
be saved.
2. When the zip file is opened, data files in TXT and SDF can be seen
data format.
To view or download an analysis report in Acrobat PDF:
- Click on the 'View Report' Button to view the report
- Click on the 'Download Report' Button to download the report
To view a surface in 3D view, click on "View Surface in 3D" next to the download icon.