Computational Uncertainty
Surface measurement instruments, such as stylus and optical profilers,
are used to characterize the roughness of engineering surfaces. Most of
these measurement instruments are microcomputer-based systems, which
contain both surface analysis software and data storage facilities.
Each measurement instrument has its own unique analysis software and
data format. When a surface is measured, the measurement instrument
generates a data file and stores it on a local disk. The data file is
then analyzed by the analysis software provided in the surface
measurement instrument. When compared, different analysis software
implementations can yield significant differences in output parameters.
The factors affecting software performance include the choice of
analysis method, the quality of software, and characteristics of data
points. The diagram below shows some sources of
uncertainty that contribute to measurement results by
analysis software [1][2].
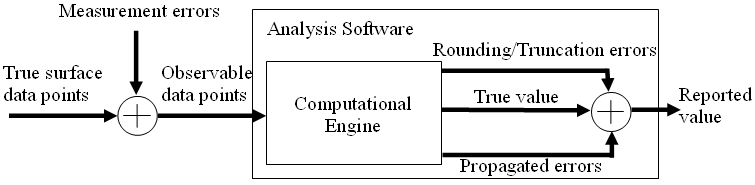
Uncertainty due
to propagated data
errors:
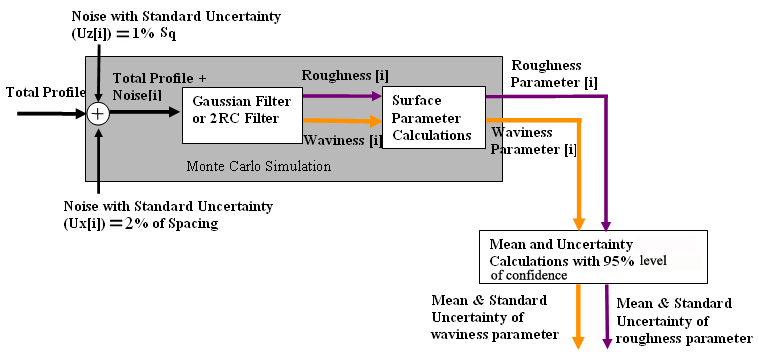
Monte Carlo Simulation [3]
- Provide a mechanism for propagated distributions through the model
- Input quantities Xi by repeating sampling from the probability
distribution functions
- Propagate these samplings through the model to give measurement
results and their standard uncertaintis
Example:
- Monte Carlo number of trials = 50000
- Sinusoidal profile with Rp=Rv=1 µm
- Measurement errors in z-direction have a normal distribution with
standard uncertainty of 0.1 µm (7% Rq in this case)
- 95% coverage
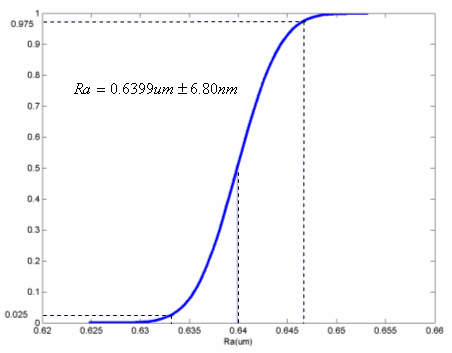
<Distribution function of Ra
Uncertainty due to truncation and
rounding errors:
See Section F.2.2.3 of "American
National
Standard for Calibration - U.S. Guide to the Expression of Uncertainty
in Measurement, ANSI/NCSL Z540-2-1997" [4].
References
1. T. Hopp, Computational Metrology, ASME Manufacturing Review, 1993
2. M. Krystek, Measurement uncertainty propagation in the case of filtering in roughness measurement, Measurement Science and Technology, 12, Issue 1, 2001, p. 63-67
3. M. G. Cox, M. P. Dainton, and P. M. Harris, Software Support for
Metrology Best Practice Guide No. 6, Uncertainty and Statistical
Modelling, National Physical Laboratory, UK, 2002
4. American National
Standard for Calibration - U.S. Guide to the Expression of Uncertainty
in Measurement, Boulder, CO : NCSL International , 1997 (2000 printing)