1. Introduction |
The region of observation of GHRS is 1100 � to 3200 �. In its echelle mode it has a resolving power of 90,000 and a wavelength accuracy of a few parts in 106. Line-of-sight velocities of stellar objects can thus be determined to an accuracy of about 1 km/s. In order to achieve this accuracy, of course, an accurate wavelength scale must be established. This is accomplished by illuminating the spectrograph with an onboard platinum/neon hollow-cathode lamp during periods in which stellar observations are not being made [3]. The use of a Pt/Ne lamp for this purpose and its space-qualified design are due to Mount, Yamasaki, Fowler, and Fastie [4], who originally suggested it for wavelength calibration of the International Ultraviolet Explorer (IUE) satellite.
To achieve the accuracy for which GHRS was designed, the calibration wavelengths must be accurate to about 0.002 �. However, tests carried out in our laboratory in 1983 indicated that the best available wavelengths for Pt [5] had errors ranging to about 0.015 �. We thus began a program to measure the spectra emitted by a Pt/Ne hollow-cathode lamp similar to the one to be used with GHRS. This work was carried out with our high resolution 10.7 m normal-incidence vacuum spectrograph at NIST. At about the same time Engleman [6] recorded the spectrum of a Pt hollow-cathode lamp with a Fourier-transform spectrometer. He obtained accurate wavelengths for 320 lines of Pt I in the region 2200 � to 7220 �, optimized the energy level values, and calculated accurate Ritz-type wavelengths for 81 lines in the region 1724 � to 2250 �. Many of these lines were used in calibrating our grating measurements.
Some of the results of our work have appeared in two previous papers. In the first [7] we determined accurate values for 100 energy levels of Pt II by combining our new grating measurements for over 500 Pt II lines in the ultraviolet with measurements of lines at longer wavelengths made by Engleman by Fourier transform spectroscopy. In the second [8] we reported wavelengths with accuracies of 0.002 � or better for some 3000 lines emitted by a Pt/Ne lamp in the region 1032 � to 4100 �. In this second report we also provided relative intensities of the spectral lines of the Pt/Ne lamp that were determined by recording the spectra photoelectrically with the same spectrograph used for the wavelength measurements.
Our wavelengths for the Pt/Ne lamp are currently being used for calibration of GHRS as well as for wavelength calibration of the Faint Object Spectrograph on HST, which uses a Pt-Cr/Ne hollow-cathode lamp for both wavelength and radiometric calibration [9]. Our data are also being used for revised calibrations of spectra from the IUE satellite [10], and for calibration of spectra obtained with sounding rockets, which also use onboard Pt/Ne hollow cathode lamps [11]. In a different type of application, the data are being used to interpret the spectra of stars that contain Pt in anomalously high abundances [12].
In the present paper we present a comprehensive report of our observations of the Pt/Ne hollow-cathode lamp. For completeness we give a full account of the experimental work and data analysis. Some of this information has been given in our previous papers.
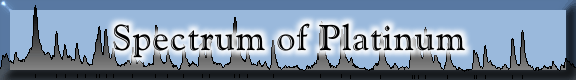
Our results are presented in the form of an atlas of the spectrum emitted by a Pt/Ne hollow-cathode lamp in the region 1130 � to 4330 �. The atlas consists of plots of the spectrum accompanied by tables that include the wavelengths, wavenumbers, intensities, and identifications or classifications where known for more than 5600 lines. We have attempted to provide the best available wavelength data, substituting values from the literature or calculated Ritz-type wavelengths where these are more accurate than our measurements.
The line list developed in this work was communicated to J. Blaise and J.-F. Wyart of the Laboratoire Aimé Cotton, Orsay, France, who have used it to substantially extend the energy level analysis of Pt II. Based on our measurements they have located nearly 150 new Pt II levels. Their report on the analysis appears as a companion paper in the same issue of this journal [13]. Blaise and Wyart have also located about 100 new levels of Pt I. The new line identifications for Pt I and Pt II have been provided to us and are incorporated in the atlas.
The data included in this atlas should be of use not only for astronomical spectroscopy but also for the calibration of general laboratory spectra obtained with medium to high resolution diffraction grating spectrographs. No other source provides such a dense and complete coverage of this spectral region with lines suitable for use as reference wavelengths. The Pt/Ne hollow cathode is easy to operate and is commercially available at moderate cost.
|
|
 |
|