Filter and Surface Parameters Menu
The 'Filter and Surface Parameters' menu displays the filter and surface
parameter calculation interface which allows the user to filter a profile
and calculate surface parameters. To filter a profile, the user has to do the following:
1. On the right menu, select the Filter Type. Under that is Filter label select
the Method used to filter a profile. If the user selects Gaussian filter, there
is an option where the user can select a width for the Gaussian window used in the
calculation.
2. Select a long cut off wavelength on the drop down menu.
3. If a short wavelength needs to be removed from the profile, the 'Short Cutoff' has to be checked,
and then the value of the short cutoff length must be selected.
4. Click 'Calculate' button below the Short Cutoff label to filter the
profile .
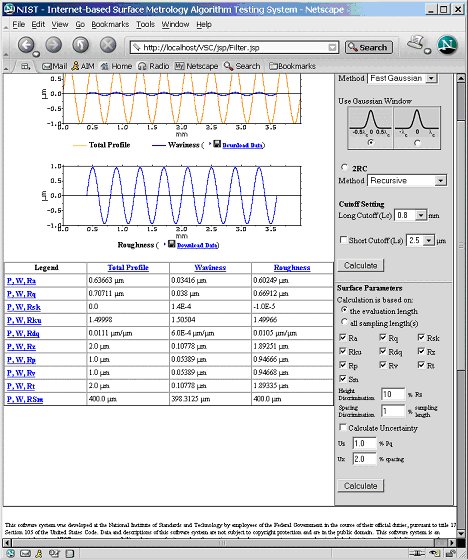
The result shows two plots on a screen. The first plot shows a total profile, a
least-squares-removed profile, or a primary profile along with a waviness
profile. The second plot shows the roughness profile.

To calculate surface parameters:
1. Select an option indicating how surface parameters will be calculated. If the
user selects the calculation based on given sampling lengths, the user must
enter the number of sampling lengths.
2. Select which parameters are to be included in the analysis. If the user selects the
Sm parameter, he/she has to enter values for height discrimination and
spacing discrimination.
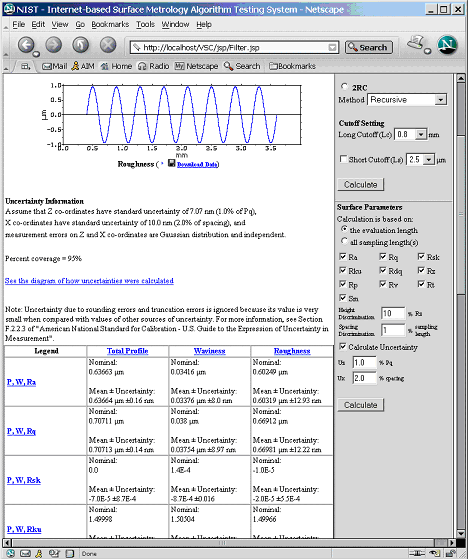
3. If uncertainties need to be included in the calculations, the 'Calculate Uncertainty' must be checked and values for
Uncertainty of x and z coordinates have to be entered.
4. Click on the 'Calculate' button below Spacing Discrimination label to calculate
surface parameters.
The results of calculated surface parameters for waviness, roughness,
total profile or primary profile are shown in a table.
To download analysis data:
1. Click on the floppy disk icon and the Save dialog will display. It will ask the user where a zip file will
be saved.
2. When the zip file is opened, the user will see data files in XML, DTD, and SDF
data format.