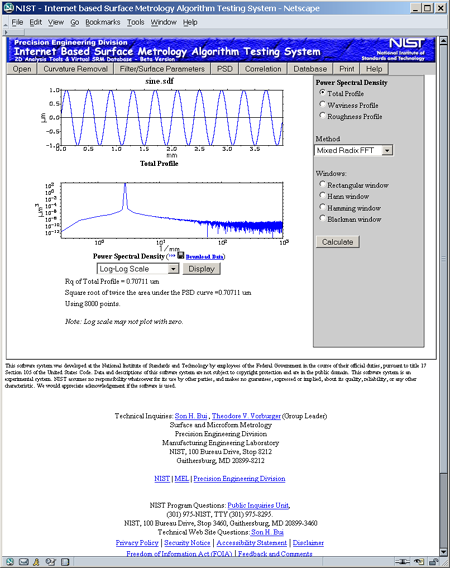
Power Spectral Density (PSD) Menu
The 'PSD' menu displays the power spectral density interface which
allows the user to perform the power spectral density analysis on a profile.
To perform the analysis, the user
1. On the right menu, select type of a profile, such as total profile, primary profile,
waviness, or roughness
2. Select a method to calculate Fourier Transform
3. Select windows to smooth the PSD. A default is a rectangular window.
3. Click on the 'Calculate' button to perform the analysis.
The result shows two plots. The first one shows the profile selected for
power spectral density analysis. The second one shows the power spectral density
curve.
To change a PSD plotting scale:
1. On the drop down menu below the PSD curve, select a linear-linear,
linear-log, or log-log scale.
2. Click on the 'Display' button to display the plot.
3. Click on the region on the PSD curve to zoom in the area that you
want to view.
To download analysis data:
1. Click on the floppy disk icon and the Save dialog will display. It will ask the user where a zip file will
be saved.
2. When the zip file is opened, the user will see data files in XML, DTD, and SDF
data format.